- Published on
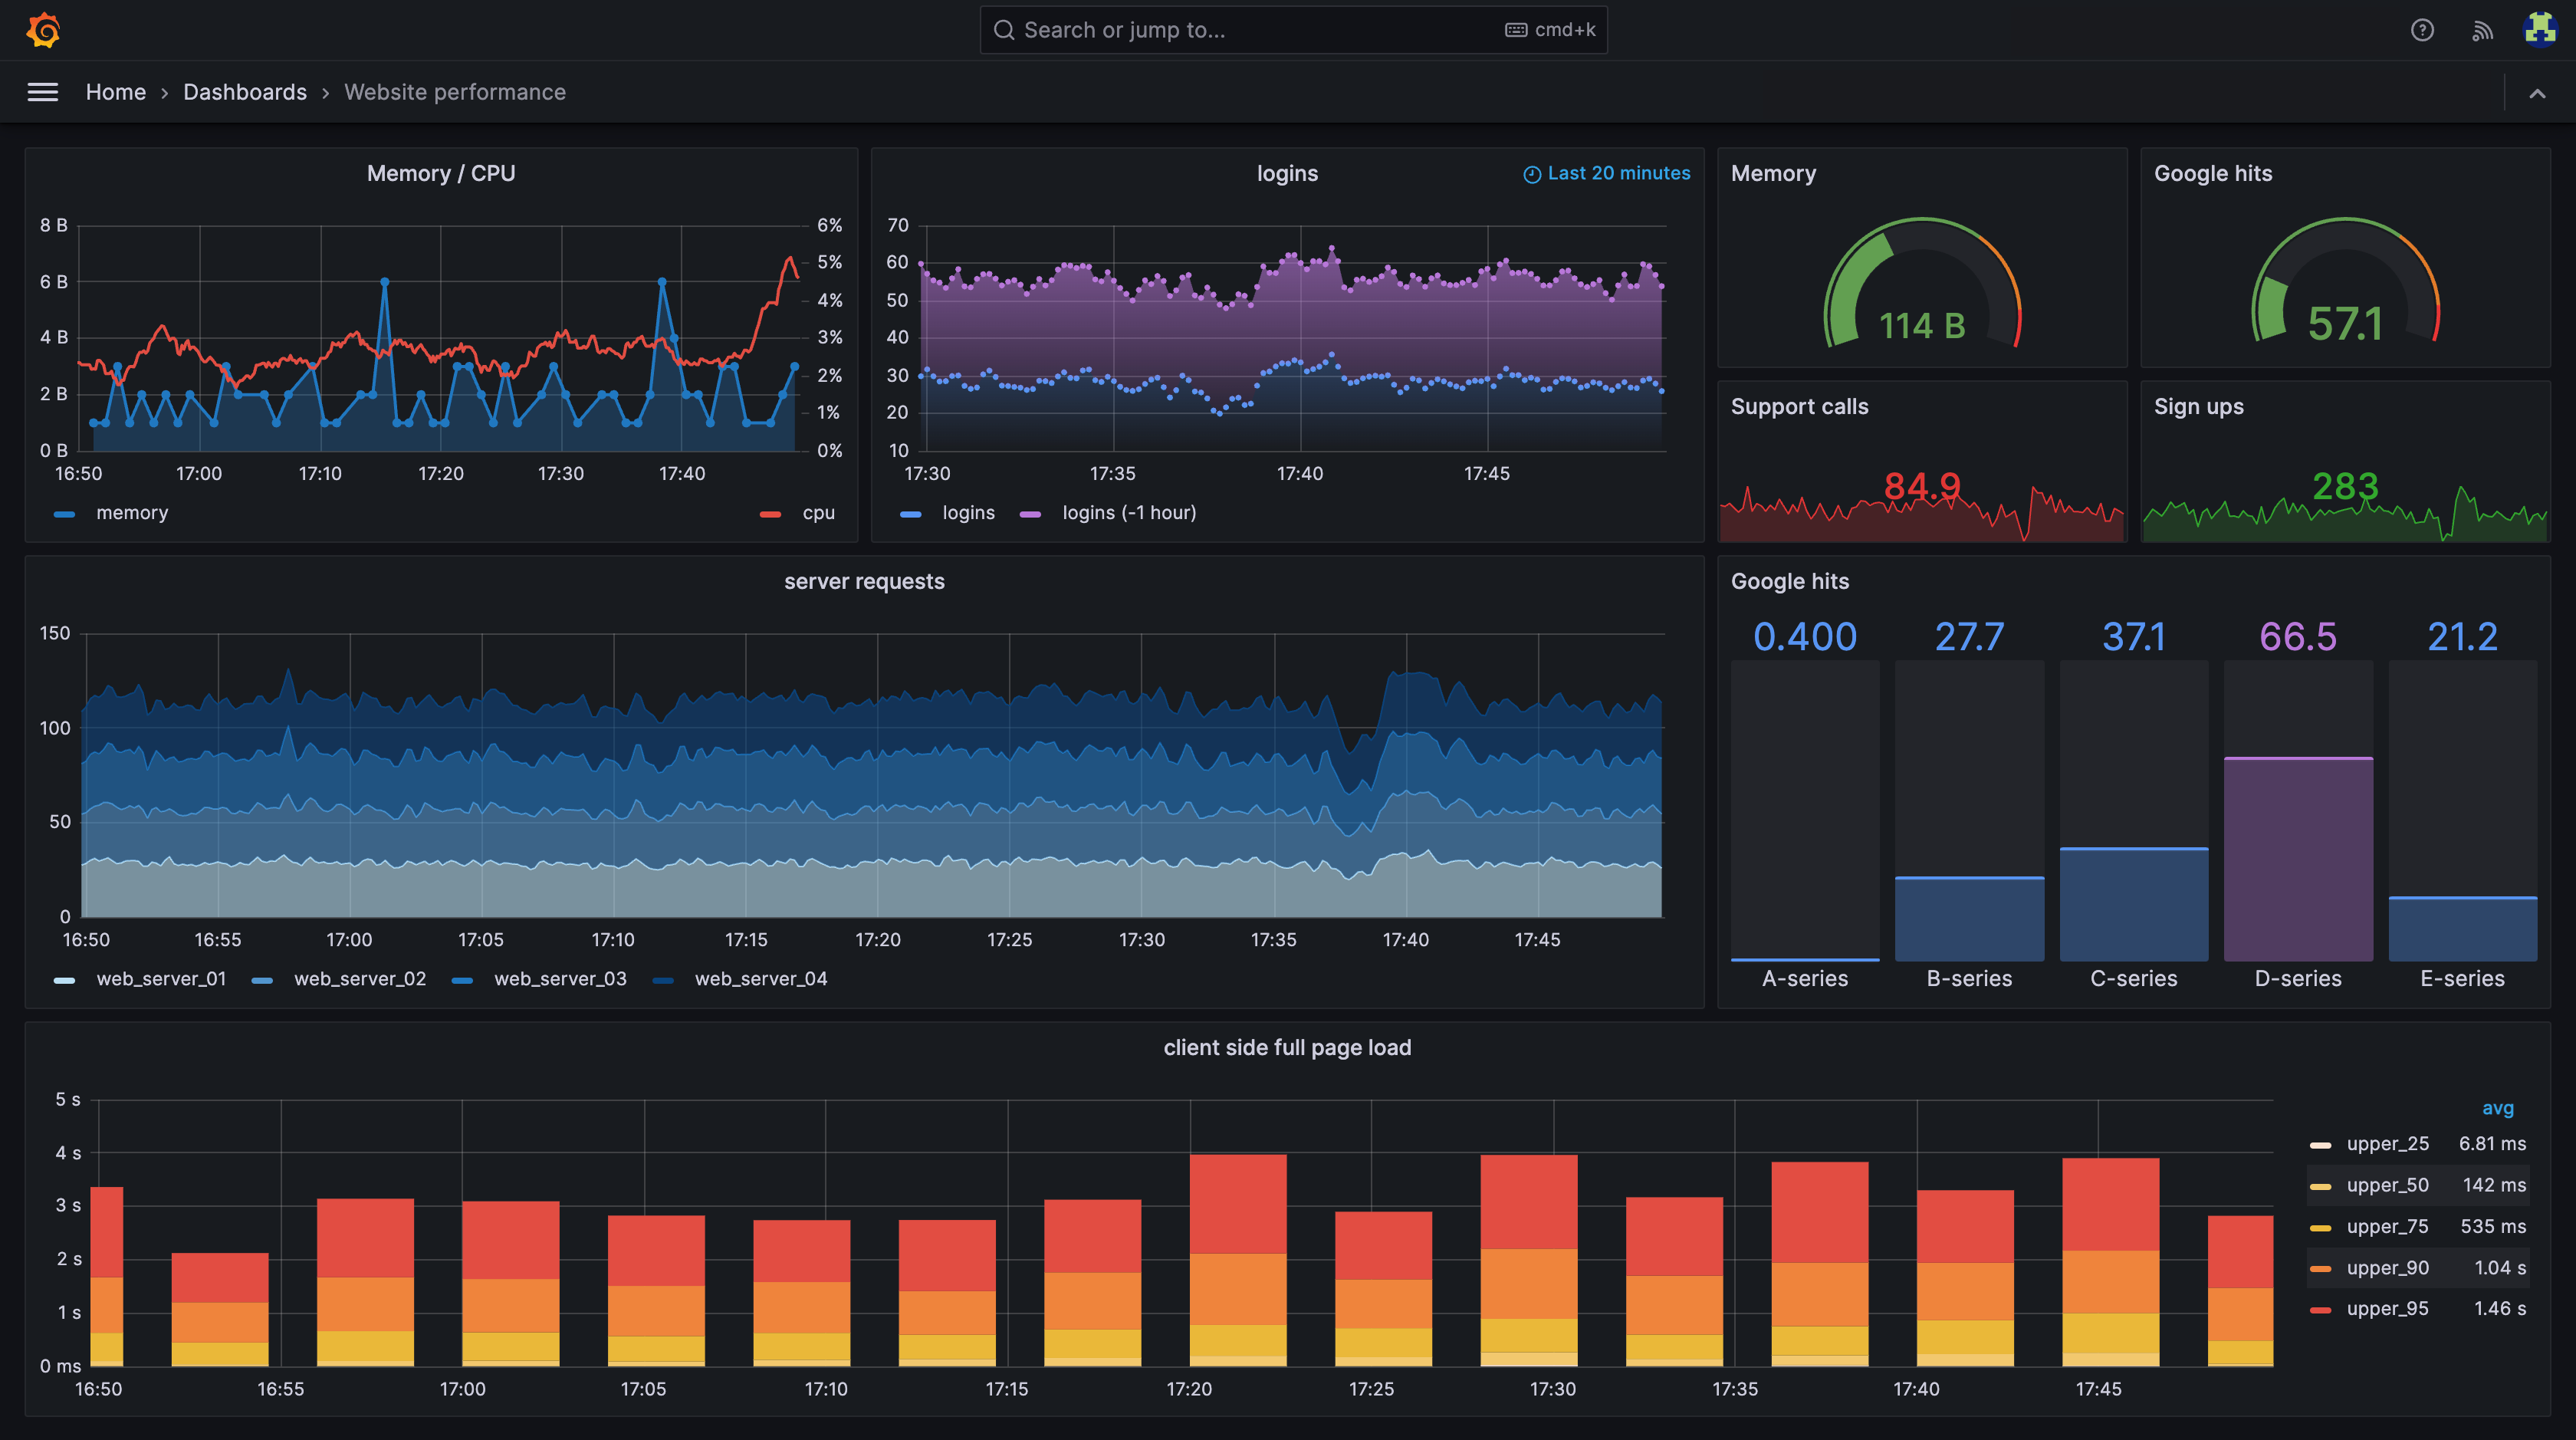
Monitoring my Life with Grafana, Prometheus, and InfluxDB
Story
I'm a data nerd and love to collect data and optimize stuff based on that. I have been using tools like ActivityWatch, Wakatime, and Smartwatches to monitor myself. But so far all that data was scattered across different places and it was hard to get a holistic view. And this made it really hard to understand patterns and optimize.
Last weekend, I learnt about Grafana and Prometheus out of curiousity. I used to love Metabase + PostgreSQL combination but Grafana + Prometheus + InfluxDB combination is a different beast altogether! It's very powerful and extensible.
The Setup
ActivityWatch dashboard

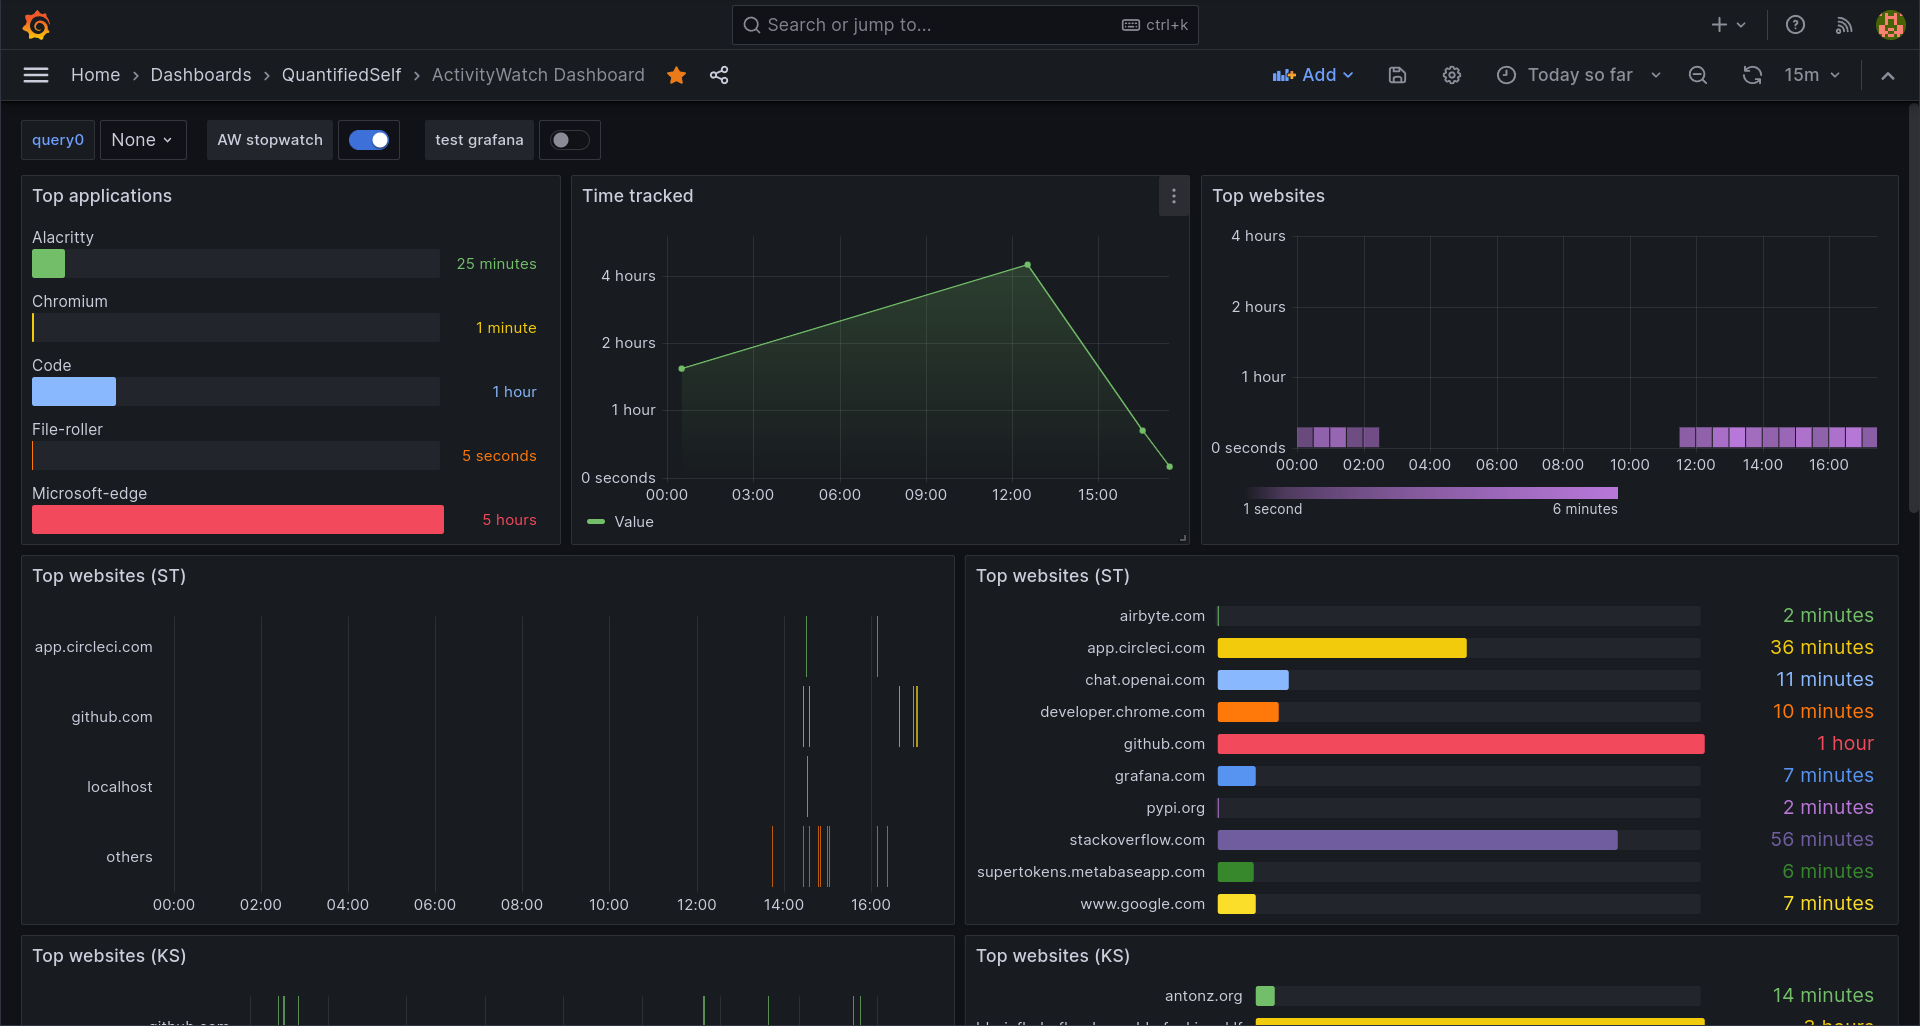
So the data in the first dashboard that I've shared above comes from ActivityWatch
ActivityWatch stores all the data in a SQLite DB and I tried using it when I started. Grafana has a plugin for SQLite and I could mount the file in grafana container and make it work. But I was curious about time series databases like InfluxDB and was hoping that it provide better util functions to make querying my (time-series) data easier. So I wrote an InfluxDB adapter for ActivityWatch that I've shared on Github KShivendu/aw-core-influxdb. And then I created the charts using InfluxDB queries as shown in the above dashboard.
Health dashboard

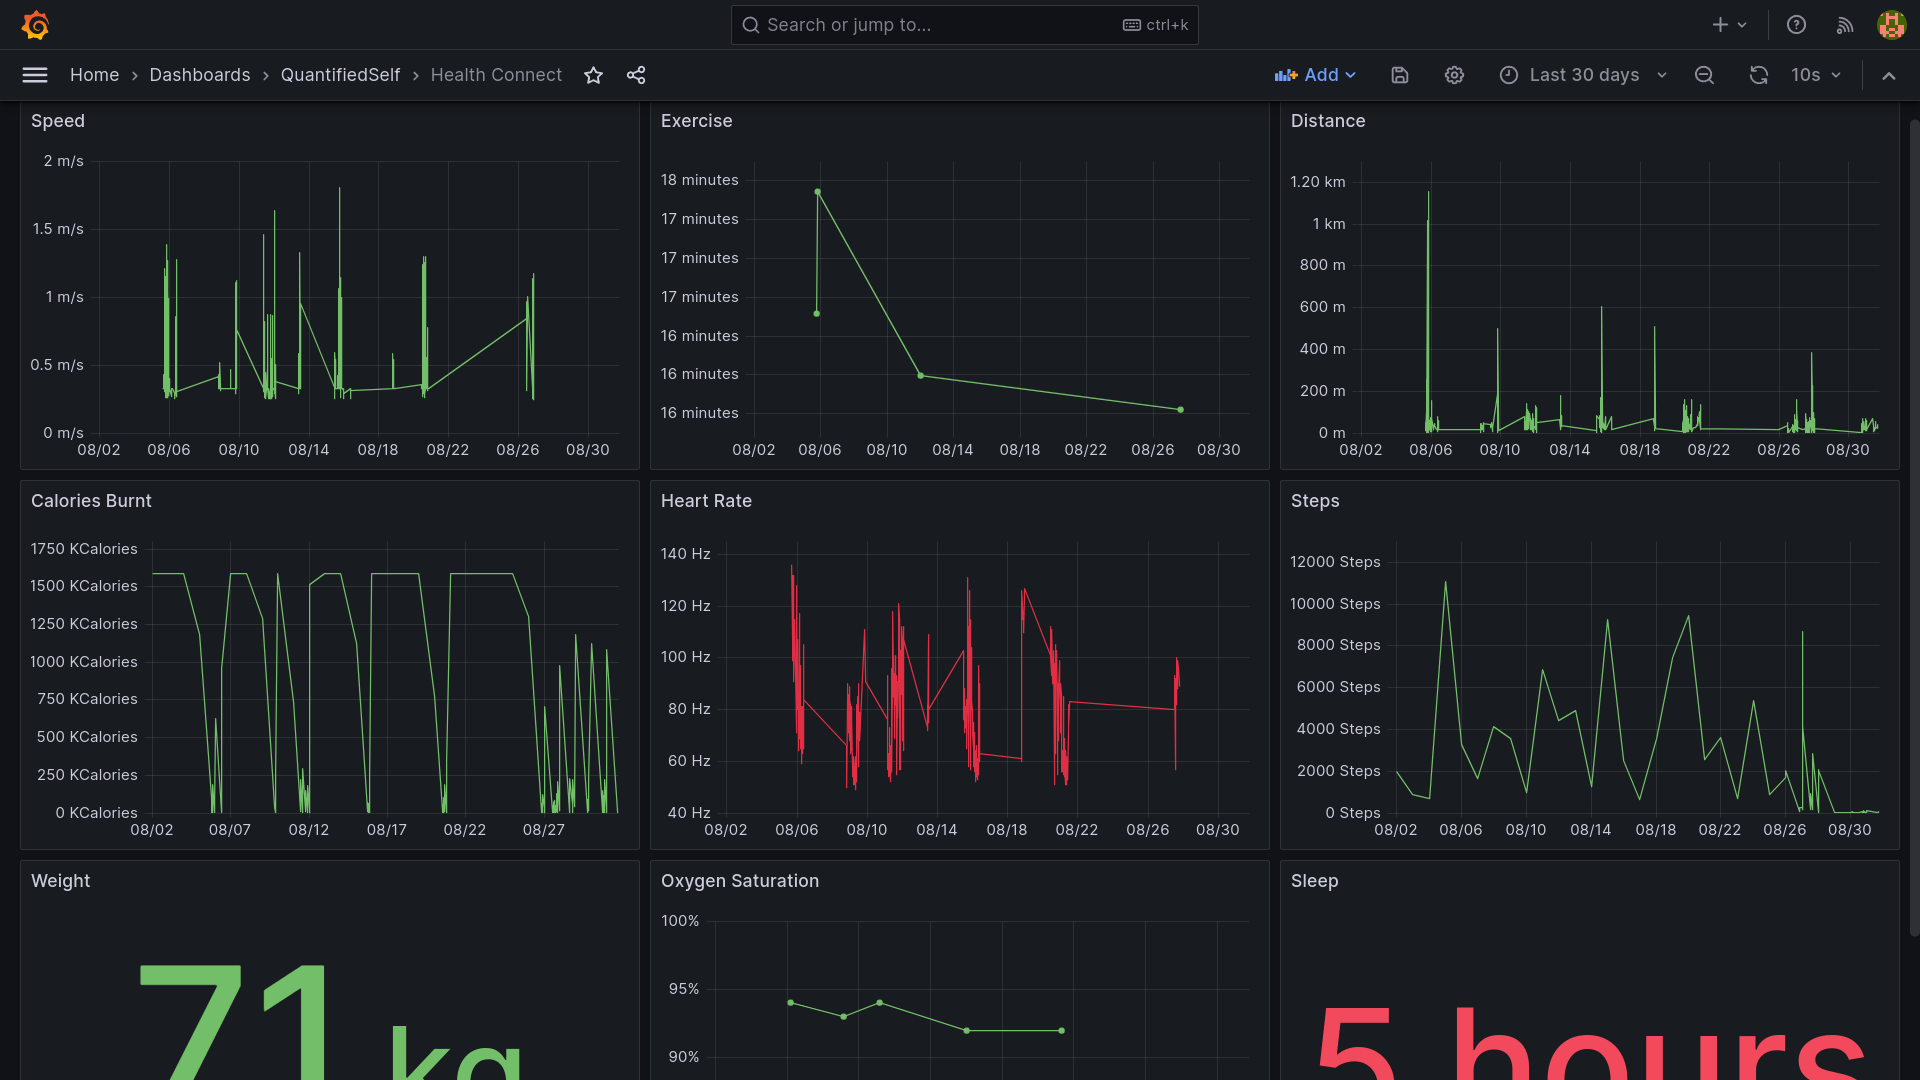
Health data has always been scattered and hard to access but thanks to the new Android Health Connect APIs and its react native library, I was able to pull all the health data given by Google Fit and Samsung Health. I wrote a small Flask server to sync the data. The flask server extracts the metric values (sleep duration, steps, heart rate, etc) and pushes all the data to my InfluxDB instance. Then I created custom dashboards in Grafana using InfluxDB queries.
Wakatime dashboard
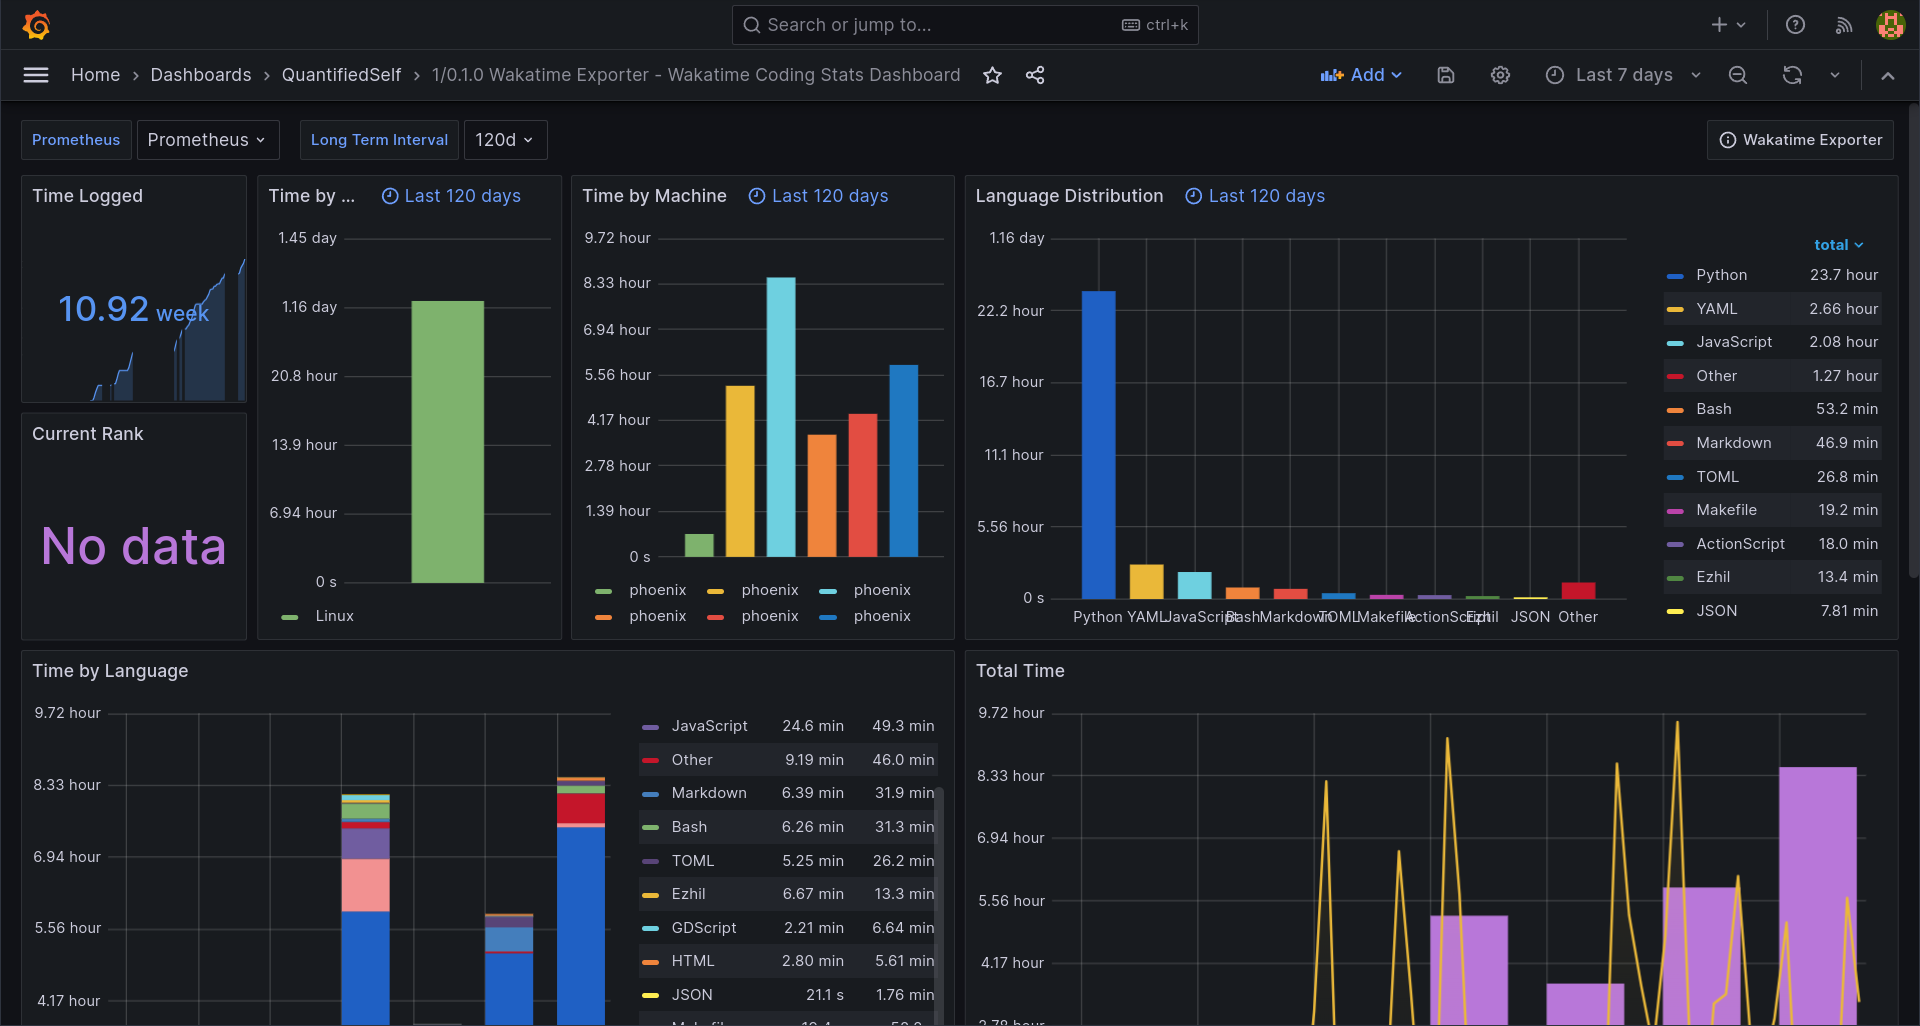
I configured my Wakatime API keys in Wakatime Prometheus Exporter and configured my prometheus instance to scrape the data from it every day. Then I directly downloaded this Grafana dashboard that shows me all the stats.
Future:
I'll be adding more details and probably try to share the code if people are interested.
- Adding time spent on Android mobile apps
- Adding location data from Android
Here's a link to my original tweet
Note that like most of my blogs, I'll keep updating this one as my knowledge grows.